
.png)

Across immigration courts in 2026, a new pattern has emerged: single judges presiding over hundreds of respondents in a single half-day session. On the docket, these can look like several separate hearings scheduled back to back. In practice, they function as one. Advocates have come to call them “mega masters,” and the data suggests the practice has moved from occasional to routine this year. What follows is an initial look at how widespread it has become and what early signs suggest about its effects.
For this analysis, we define a mega master session as any half-day morning or afternoon docket with 50 or more primary respondents before a single active judge. Because the phenomenon is new and no official definition yet exists — as Austin Kocher notes in his recent analysis — the data below should be read as a first look, not a final account. Drawing on data and emerging trends from across our large immigration legal-aid nonprofit network, along with input from internal experts including former immigration judges, we present each finding as an early indicator that warrants continued attention.
7:30 am : A Surge in Scheduling
For most of the past 18 months, 7:30 AM hearings were scheduled in modest, fairly stable numbers each month. That changed sharply in the summer of 2026.
Throughout 2025, courts scheduled roughly 40 to 580 hearings at 7:30 AM per month. That volume carried into the first months of 2026 as well, staying in a similar range through May. Then in June, the number jumped to 2,020, more than 4.5 times May's level and far above anything seen in the prior 18 months. July shows another 1,607 scheduled.
These are scheduled hearings, not a record of what happened at them. This doesn’t confirm if a hearing proceeded, was continued after taking place, or never happened at all. What the data does show clearly is the scheduling pattern itself: courts are placing far more hearings at 7:30 AM than they were even a few months ago. Whether this reflects a real expansion of the court day or something else will become more clear once data for June is released.
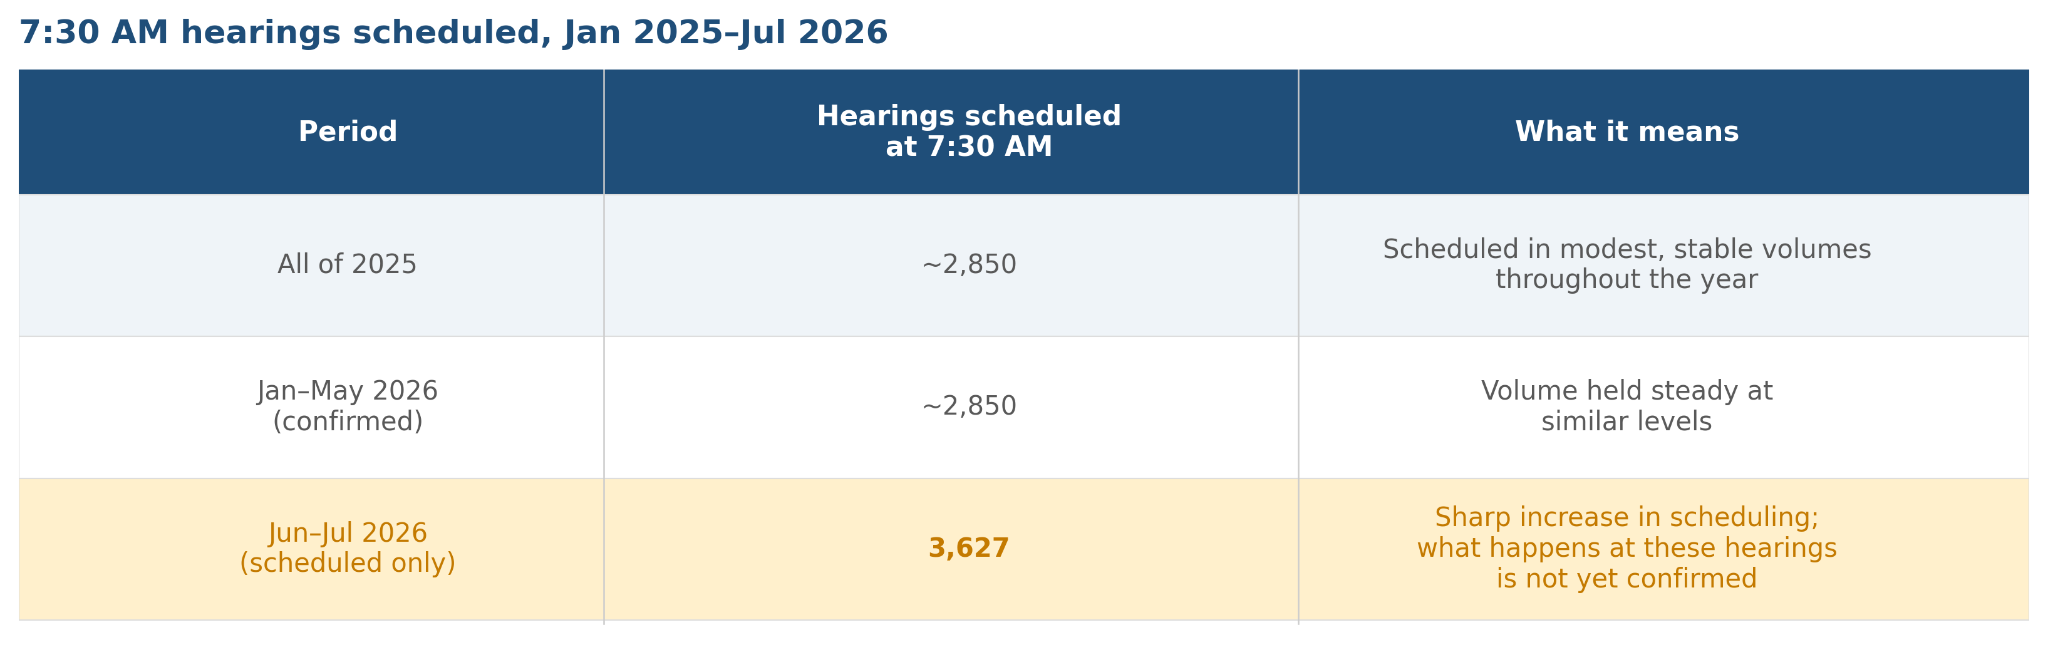
Figure 1. Hearings scheduled at 7:30 AM, Jan 2025–Jul 2026. All figures reflect scheduling data; whether these hearings proceeded is not confirmed.
Hearing Types: The Shift Towards Resets and Special Masters
Looking across all master hearings, not just mega masters, the mix of hearing types being scheduled has changed significantly since 2024. Initial masters (the hearings that land fresh on a judge’s docket) shrank as a share of the total, from about 51% of all master hearings in January 2024 to about 41% by May 2026.
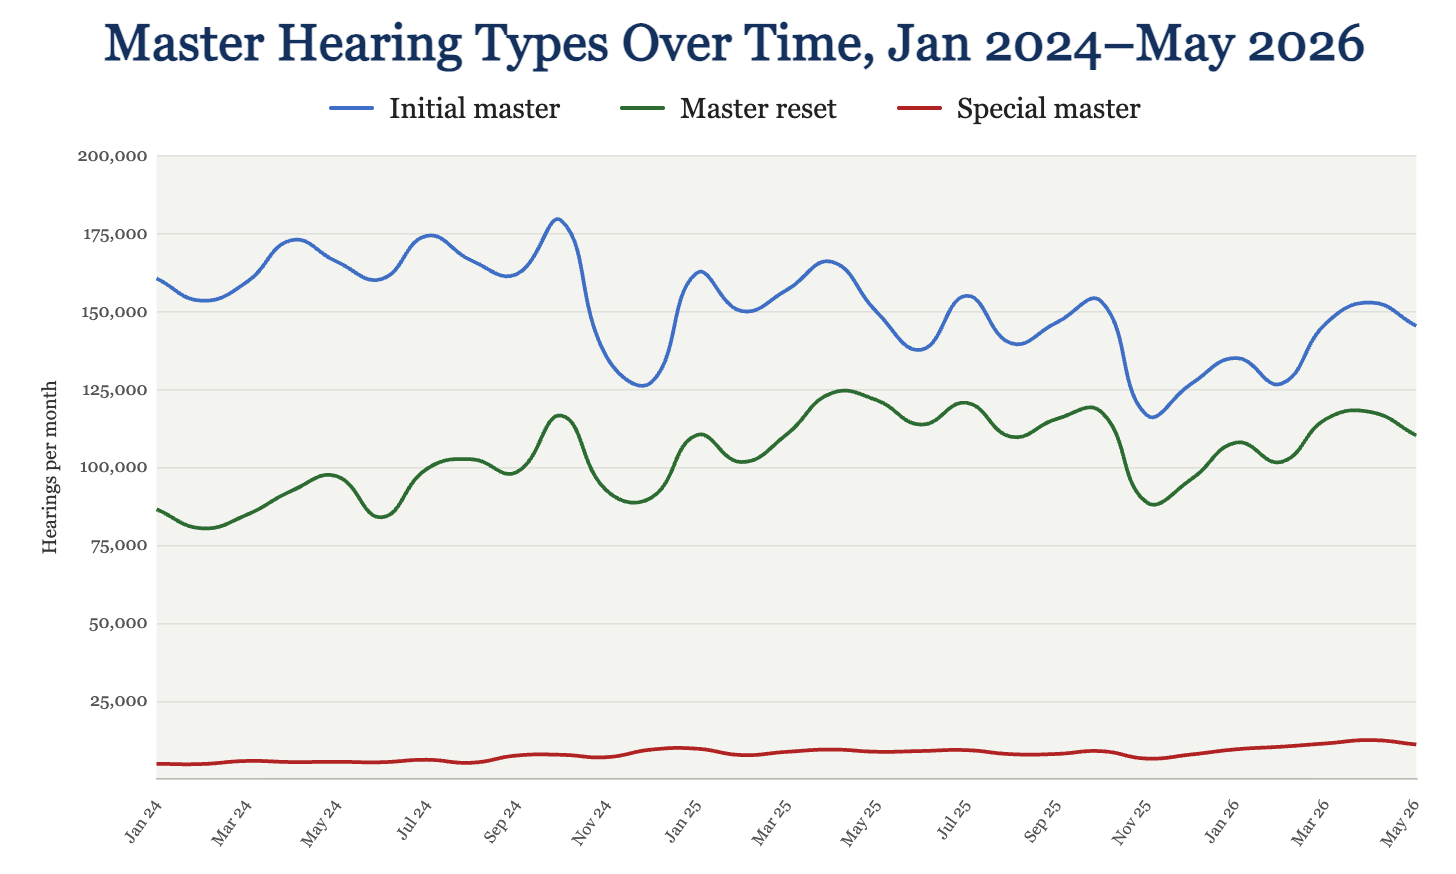
Figure 2: Master hearing types over time, Jan 2024-May 2026.
What grew instead: master resets, up 27% in raw count and now nearly a third of all hearings, and special masters, which more than doubled, up 126%, from about 4,900 to 11,100 a month. Special masters remain a small share of total hearings, but no other category is climbing this fast.
That shift raises a question about the underlying cause. A surge in initial masters would point to fresh intake, DHS pushing more new cases onto dockets. Instead, the growth is in hearings that already exist getting reset, reclassified, or routed into a special docket, which may point less to new cases arriving and more to existing cases being reprocessed.
New and Accelerating
Large-volume master hearings have existed for years, but not at anything close to today's scale. Since 2020, the number of “mega masters” scheduled in May has grown more than 10 times over, from 51 to 544. Their share of all scheduled master proceedings has nearly tripled, from 0.10% to 0.27%.
The growth has not been linear. Numbers dipped in 2021 during COVID-era court slowdowns, then climbed steadily from 2022 onward. The sharpest jump came between 2025 and 2026: a 60% increase in a single year, well above any prior year's pace. Because scheduling records include all slots ever placed on the calendar, proceedings later rescheduled may appear in more than one year; the trend is directionally valid but absolute counts should be read as approximate.
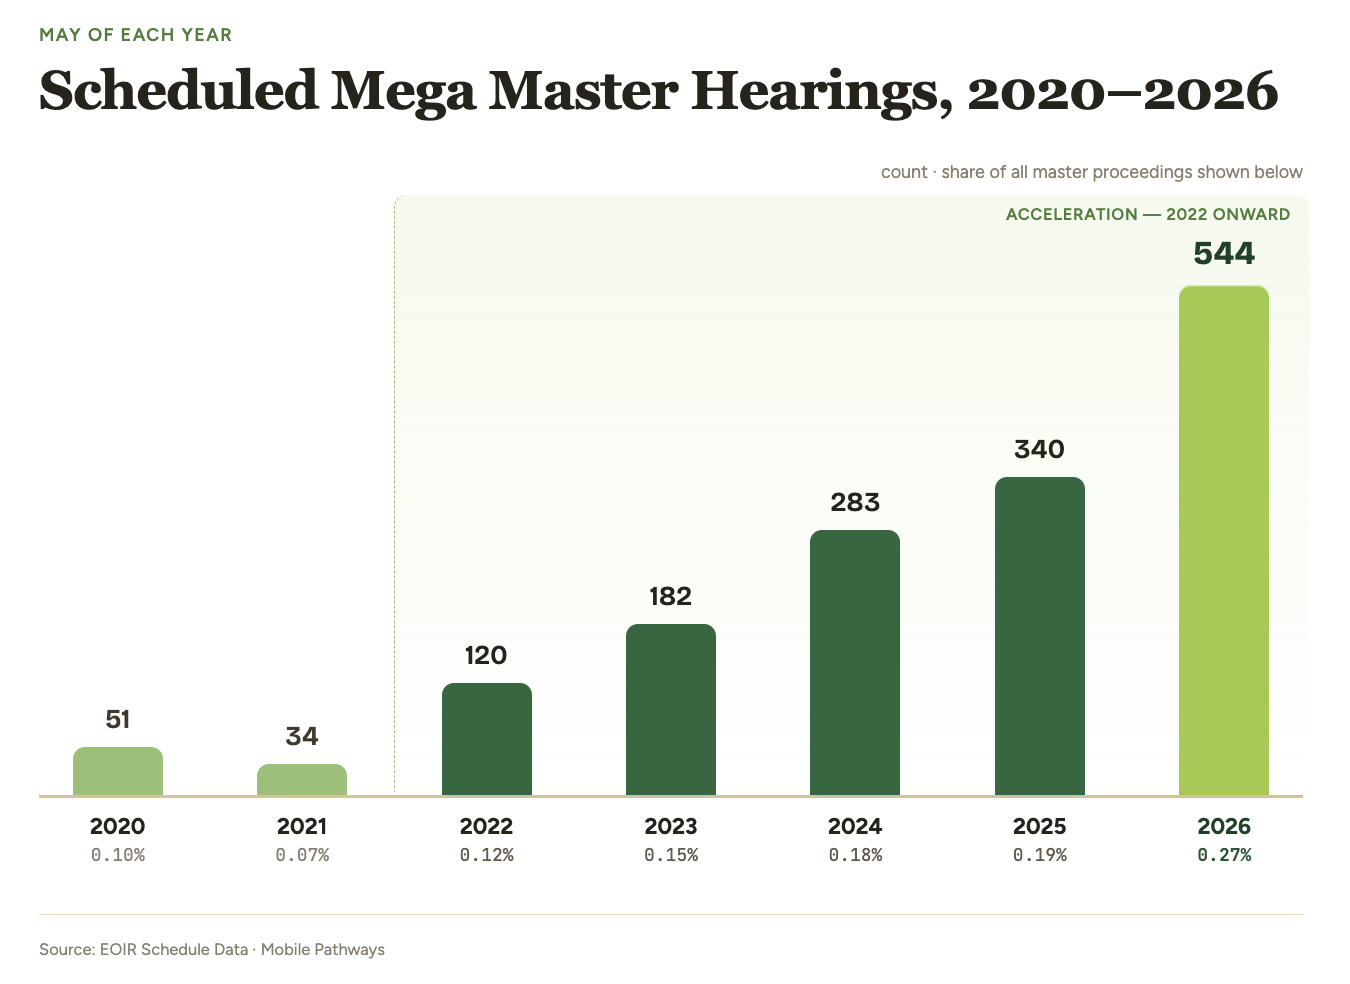
Figure 3. Scheduled “mega master” sessions (50+ primary respondents in AM/PM sessions) in May of each year, based on EOIR scheduling records.
For this and the sections that follow, a mega master session is any AM or PM half-day docket with 50 or more primary respondents scheduled before a single active judge, meaning the lead cases, not counting riders (family members or others formally linked to a lead case). Once a session meets that threshold, all respondents, primary and rider alike, are included in the volume figures that follow.
The Calm Before the Storm: January-May
The most recent EOIR data release runs through May, but the numbers show the pressure was already building. As defined above, primary respondents set the threshold for what counts as a mega master session. Once a session qualifies, this section tracks total respondents, primary and rider combined, to capture the full scale of who is affected.
That choice matters because counting total respondents can make large dockets appear less common than they actually are. In practice, master hearings were typically limited to about 25 to 30 primary respondents per AM or PM session, so a threshold of 50 already marks a clear departure from that norm. Using a 50-primary threshold identifies 2,450 large sessions between January and May 2026, compared with 388 sessions under a stricter 100-total-respondent approach. Much of the recent increase in docket size sits below that higher bar.
The data shows that these large sessions are no longer isolated events. Between January and May, the number of mega master sessions increased from 466 to 570, while the number of respondents appearing in them grew from about 37,300 to nearly 50,000, a 34% increase in five months.
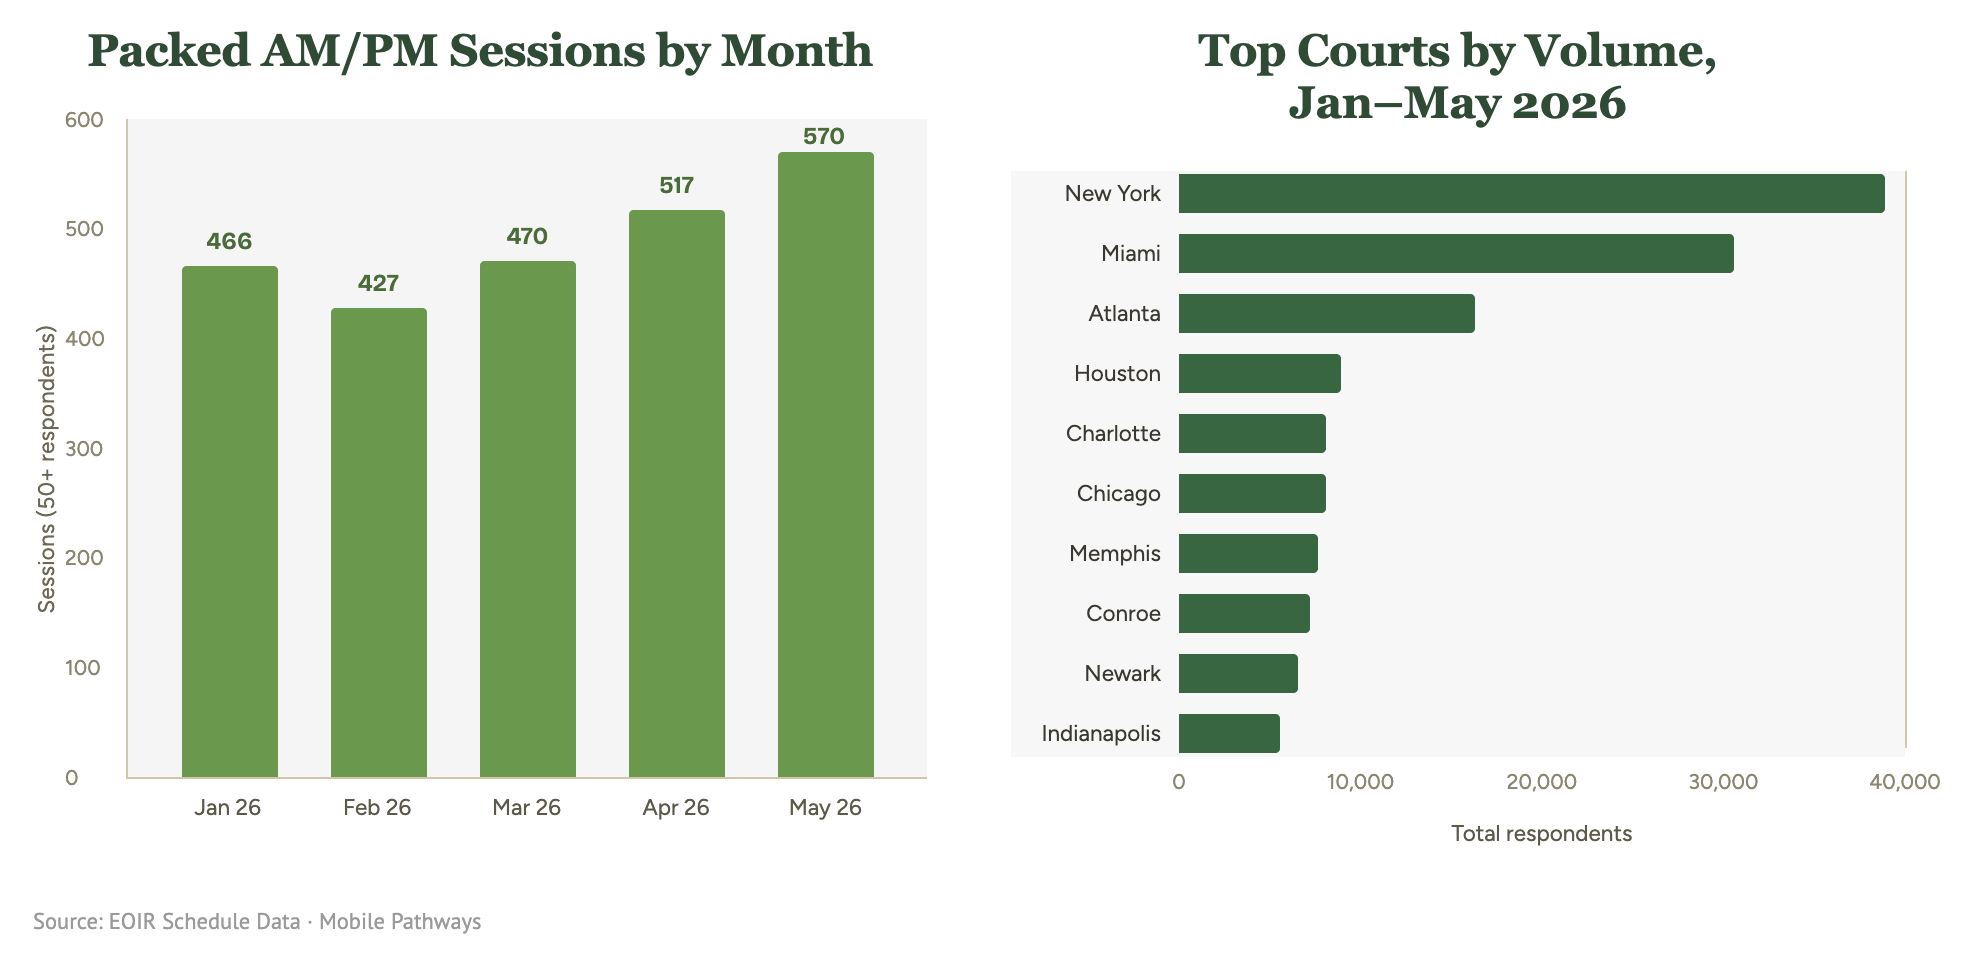
Figure 4. Immigration court sessions with 50+ primary respondents by month (left); top courts by total respondents (right), Jan–May 2026.
Volume is concentrated in a handful of large courts, but not dominated by any single one. New York led the January–May period with 38,874 total respondents across 458 sessions, representing 19.4% of all respondents in this period. Miami followed with 30,603 (15.2%), then Atlanta with 16,304 (8.1%), and Houston with 8,938 (4.4%).
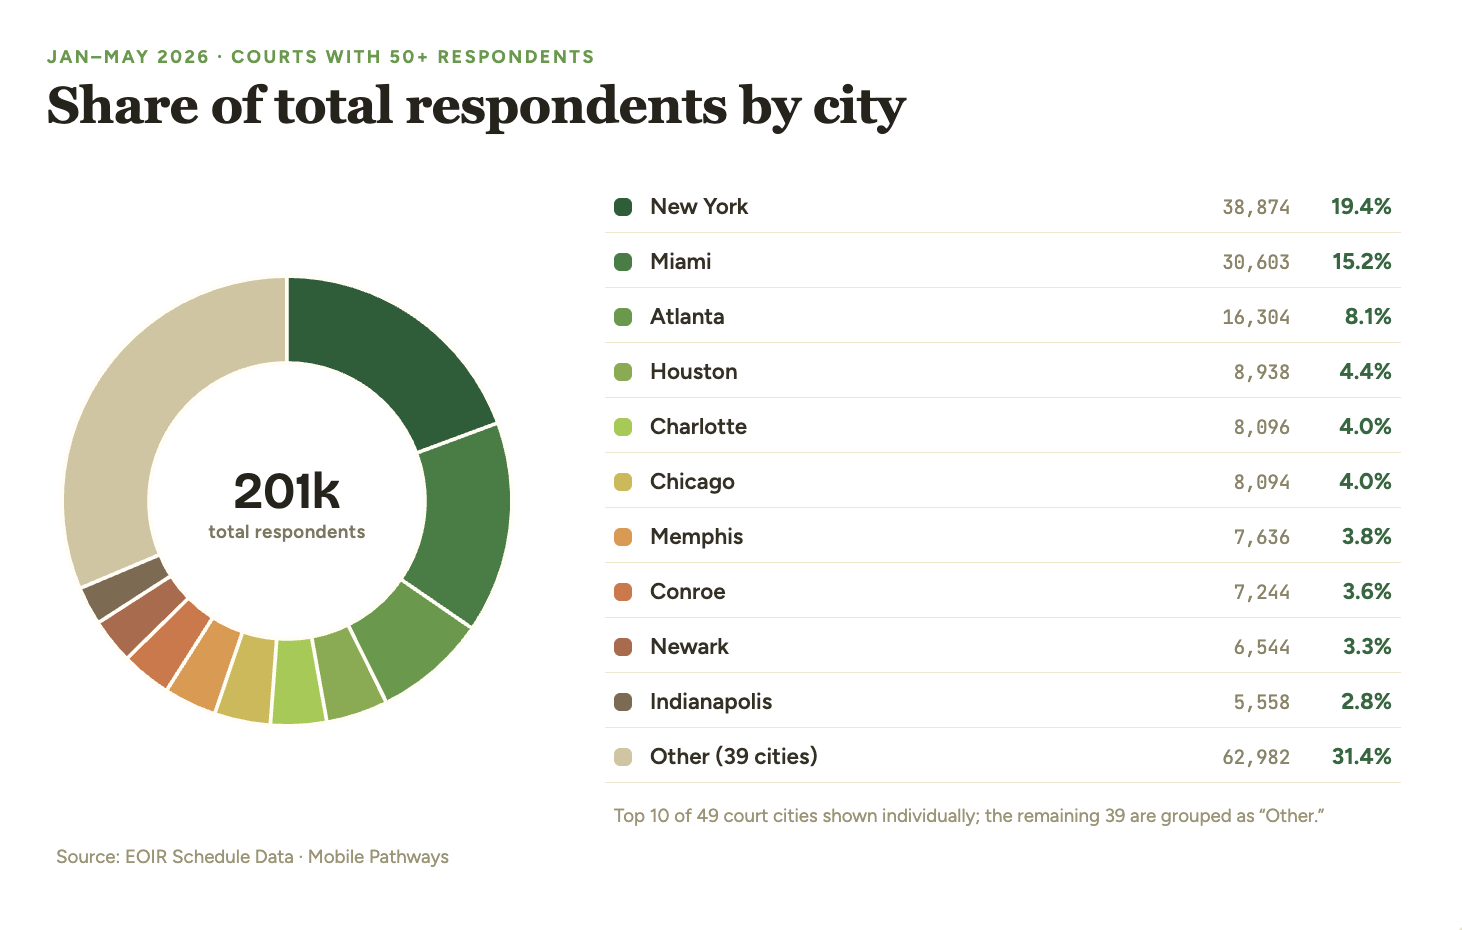
Figure 5. Share of respondents by city, Jan–May 2026 (AM/PM sessions with 50+ respondents).
Rider usage also varies widely across courts, which is one reason primary respondents provide a more stable comparison. Newark runs the highest rider share at 34.8%, with Charlotte (32.8%), Dallas (32.7%), and Chicago (32.3%) all near that level. New York and Miami run lower at around 23%. Conroe is the outlier in the opposite direction: it appears eighth by total respondents but carries almost no riders, just 2 out of 7,244 total respondents across 113 sessions. That means Conroe’s dockets are almost entirely lead cases with no attached family members, a pattern unlike any other high-volume court in this dataset and one worth watching as more data becomes available.
Between January and May, nearly half of the nation's active immigration judges, 323 of 718, presided over at least one mega master session, and 150 had five or more. Because judge rosters shift over time, this comparison is approximate, but the breadth is striking regardless. The clearest outlier was a May 22nd session by Judge Jonathan W. Owens in Cleveland with 358 primary respondents, roughly 5.8 times the dataset average and more than double the next-largest session.
The scheduled June data suggests the trend is accelerating. With 633 sessions and 60,324 total respondents, June is projected to run about 21% above May on both measures. New York remains the largest by scheduled volume, while Chicago and Dallas follow. Harlingen stands out less for total volume than for intensity, averaging about 105 primary respondents per scheduled session.
Early Outcomes: A Cautious First Look
Assessing the consequences of mega masters is difficult this early. But because advocacy groups such as the National Immigration Project and the Acacia Center for Justice have warned the practice could drive mass deportations, we took an initial look at the courts with the highest concentration of mega masters against rates of in absentia removal orders. The stakes are high: 99% of in absentia cases end in a deportation order.
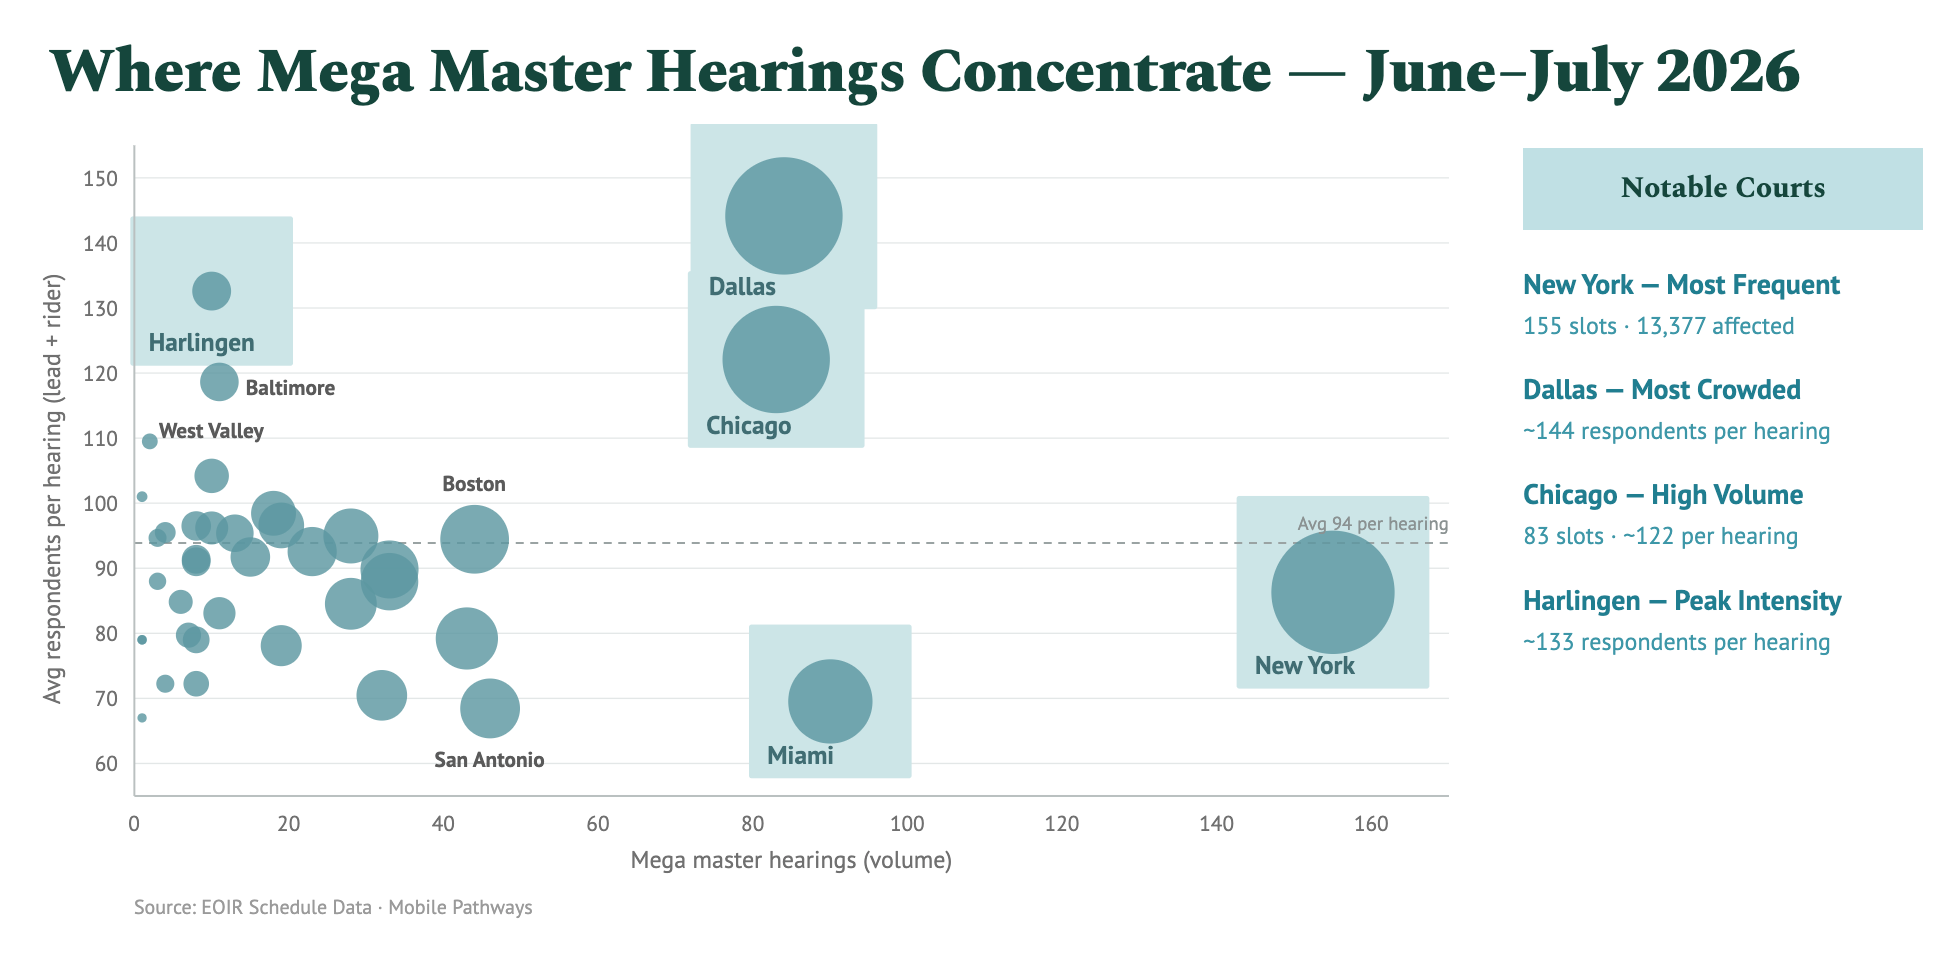
Figure 6. Mega master session volume and average respondents per hearing by court, June–July 2026 scheduled data. Bubble size reflects total respondents affected.
The five courts below stand out for the frequency and size of their sessions, and for the significance of the outcomes. In May 2026, these five courts together accounted for 28% of all master calendar proceedings nationwide but generated 34% of all in absentia removal orders.
- Dallas: High sessions + highest average respondents
- New York: Highest session count
- Chicago: High on both dimensions
- Harlingen Unusually high average respondents for low volume
- Miami Second highest session count, smaller hearings overall
That finding, however, comes with an important caveat. Mega masters scaled significantly only in mid-May, meaning the full effect of the practice is not yet visible in one month of data. EOIR data is also routinely backfilled as cases are finalized, so current figures likely undercount what actually occurred. The in absentia rates here are a floor, not a final picture.
What the data does show is significant variation within the group. Dallas, the most crowded mega master court by average session size, recorded a 29.3% in absentia rate in May, more than double the national rate of 12.3%. Chicago followed at 20.1%. Miami and New York, despite their high session volumes, both came in below the national rate at around 7%. The pattern suggests that session volume alone does not predict in absentia outcomes, and that other factors, including how hearings are noticed and how much time respondents have to appear, may matter as much.
“What stands out here isn't just that mega master sessions exist, it's how fast they've become normal. Going from a handful of dockets to hundreds of judges running these sessions in mere months is a structural shift That points to a real question of whether respondents are getting a meaningful chance to be heard,”
Elizabeth L. Young, former immigration judge.
A Note on the Data
This analysis draws from EOIR's monthly FOIA data as loaded into Pathfinder, not a live court feed. Data runs through May 31, 2026. June and July figures entirely come from EOIR's forward scheduling calendar and reflect hearings as currently scheduled, and they will change as hearings are added, modified, or canceled before they occur.
Hearing activity uses EOIR's scheduling table rather than its confirmed case records, which is the more appropriate source for isolating master calendar hearings by type. Scheduling records include all slots ever placed on the calendar, so a proceeding that was rescheduled may be counted in more than one time period. This inflates absolute numbers somewhat but does so consistently across all years, preserving the validity of trends.
A mega master session is defined here as any AM or PM half-day docket with 50 or more primary respondents before a single active judge. This is an analytical choice, not an EOIR designation. AM and PM are determined by scheduled start time, not actual session boundaries. Riders — derivative beneficiaries formally linked to a lead case — are counted separately and do not affect whether a session crosses the threshold. The analysis covers active judges only, plus named judges not yet catalogued in Pathfinder's registry; a small number of anonymous judge codes were excluded because they cannot be attributed to a named judge.


